How much can a U.S. laser tag club earn?
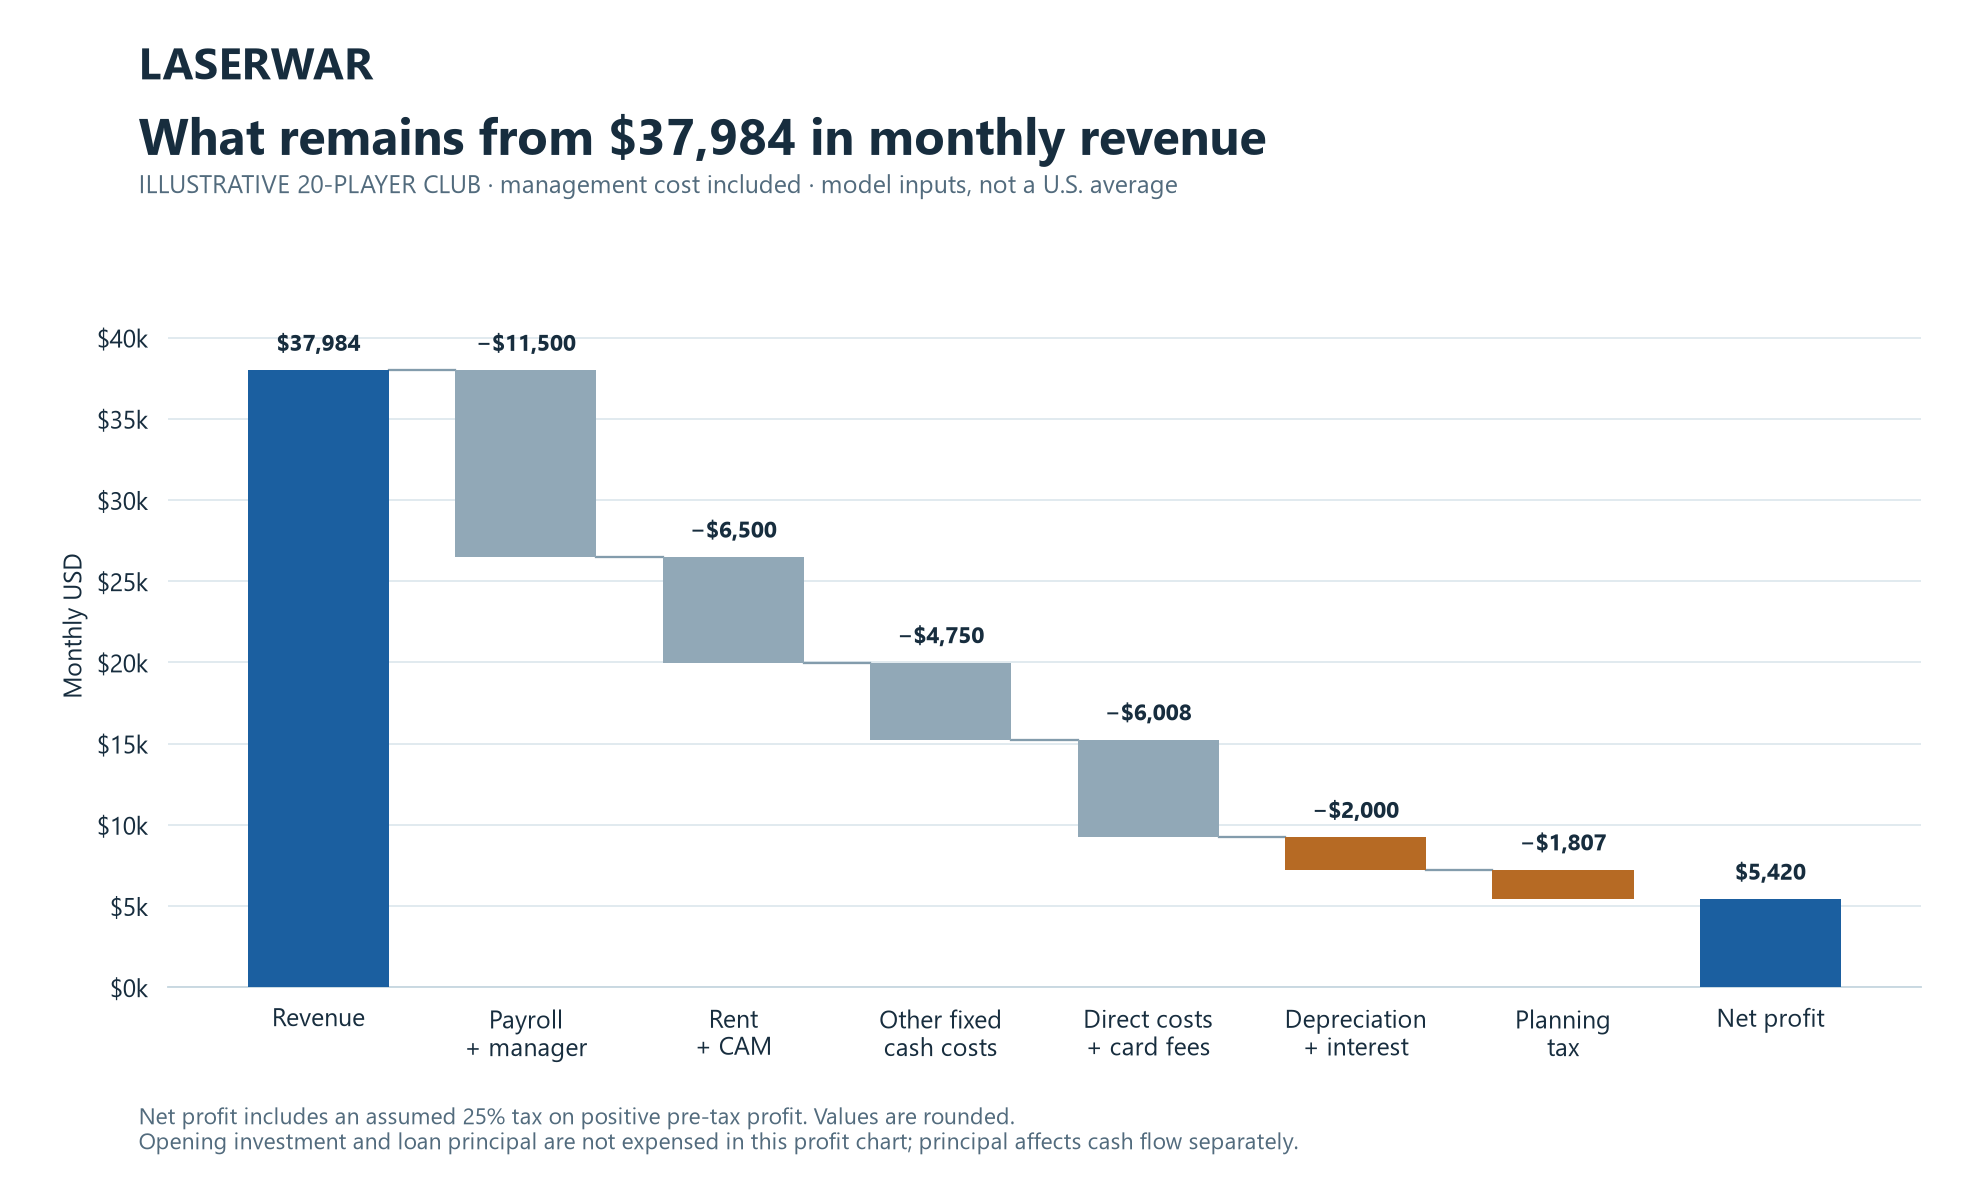
A club can collect tens of thousands of dollars in a month and retain a much smaller amount as profit. In the illustrative 20-player business below, monthly revenue is $37,984, operating cash surplus before depreciation, interest and tax is $9,226, and profit after the example’s depreciation, interest and planning tax is about $5,420.
$37,984 is sales revenue. $9,226 is an operating subtotal. $5,420 is the model’s profit after its stated deductions. They are calculated scenarios, not a nationwide average, a LASERWAR customer’s accounts or a promise of future earnings.
That distinction matters when choosing an attraction. The equipment invoice tells you what the fleet costs. The operating model shows what must happen each month for the business to cover its bills and reward the owner’s investment. Put the two together before deciding how many player places, party bookings and opening hours the venue needs.
Is there a reliable average profit for an American laser tag club?
A current, representative nationwide average net profit could not be verified in the public sources reviewed for this guide on November 9, 2026. Public material mixes single-attraction arenas, mobile operators and larger entertainment centers, often reporting different financial measures. An average for a bowling-and-arcade complex would not establish the profit of its laser tag operation.
IAAPA’s 2025 Entertainment Center Benchmark Report is described as global research using 2024 data. Its public description covers revenue and expenses but does not disclose a U.S. standalone laser-tag net-profit average. The full report was not available in the public material reviewed. IAAPA report scope.
There is a useful published industry claim to interpret carefully. Equipment supplier Laserforce describes a 15–40% return after management wages but before tax, interest and depreciation. Its page does not provide a dated U.S. sample or a distribution of audited venue results. Use it to understand the measure being discussed; it does not establish an average net margin for U.S. operators. Read the supplier’s profitability explanation.
The Federal Trade Commission makes a related point in its franchise buying guide: gross sales do not establish costs or profits, and an average can conceal wide differences between locations. The same reading discipline is useful when comparing an earnings claim with your own venue plan. FTC guidance on earnings claims.
| Evidence | What it can support | What still needs checking |
|---|---|---|
| A venue’s published ticket or party price | What that venue advertises for a specified product | Discounts, tax, actual sales mix, attendance and costs |
| A supplier’s profitability illustration | The supplier’s stated assumptions and definition | Sample, period, geography, exclusions and independently supported outcomes |
| A particular club’s accounts | That business’s recorded revenue and expenses | Owner labor, one-off items, financing, seasonality and relevance to your market |
| The editable model in this guide | The result of the inputs you enter | Whether those inputs describe a viable local operation |
What do American venues actually charge?
Start with products customers can buy. Compare a single mission with another single mission, and a private party with another package of similar duration and inclusions. A multi-game pass is not a single-game ticket; an all-attractions bundle also pays for other activities.
| Operator / location | Published offer | Comparison detail |
|---|---|---|
| Crown Sports Center · Fruitland, Maryland | $10 for one game; $18 for two; $24 for three | 7 minutes 30 seconds of play plus a two-minute briefing; Sunday promotion separately lists $5 games. Part of a larger sports/FEC operation. |
| Grand Slam USA · Malvern, Pennsylvania | $10 for one game; $18 for two | Ten minutes of play per game; a laser-tag product within an FEC. |
| LaserMaxx · San Jose, California | $13.99 for one mission; $25.99 for two; $35.99 for three | Fifteen-minute games; the published visit allowances are longer than gameplay, including approximately 40 minutes for one mission. |
| FlagTagAZ · Flagstaff, Arizona | $9.99 for one game; $16.99 for two; $23.99 for three | The venue describes prices as approximate and sales tax as extra; it offers several attractions. |
| Lake George Lanes & Games · New York | $6 for one game; $10 for two | Laser tag priced separately from bowling, arcade and bundled family offers; no game duration given in this price list. |
| Monster Mini Golf · Southaven, Mississippi | $10 for one game; $18 for two | Laser tag line items, separate from the mini-golf and arcade combinations. |
A party is a different product. For example, FlagTagAZ advertises its Classic Party at $30 per person with a ten-player minimum: two laser tag games, a 1.5-hour private party room, an arcade credit, pizza, drinks and cookies. Its $300 minimum package revenue cannot all be treated as single-game admission revenue or profit. Official package details.
Mission Laser RVA in Virginia lists a $270 package for up to ten players, with extra players at $20 each, two 20-minute experiences including rules and equipment, and party-room time. It explicitly describes public play. A private room does not automatically mean a private arena. The model below uses its own hypothetical party product and deliberately reserves complete arena rounds. Official booking item.
These are examples from named operators, not a statistical sample or an average price. A listed price is also different from realized revenue. Coupons, memberships, group discounts, sales tax collected for government and refunds change what the business retains. Use a net realized selling price in the calculator, then verify it against your proposed offer and local competition.
Build revenue from games and parties without counting them twice
The working example uses a 20-player arena with 100 scheduled rounds per week and 48 operating weeks per year. Spreading those weeks across twelve calendar months gives 8,000 possible player positions per month. That is a scheduling assumption, not evidence of demand or a claim about how many rounds every venue can run.
| Sales stream | Calculation | Revenue |
|---|---|---|
| Walk-in player-games | 3,600 paid games × $9 net realized price | $32,400 |
| Private parties | 16 packages × $349; each includes 12 guests and two rounds | $5,584 |
| Total monthly sales | Party admissions are included in package revenue | $37,984 |
A player-game is one person taking part in one round. A person who buys three rounds creates three player-games, not three different customers. The example’s parties add 384 player-games: 16 × 12 × 2. Those games belong in the capacity and cost calculations, but their admissions must not be charged again as walk-in revenue.
For private parties, reserve the whole round. Sixteen parties using two rounds block 640 potential player positions in a 20-player arena, even though only 384 are used. Add the 3,600 walk-in games and the schedule commits 4,240 of 8,000 possible positions, or 53%. The remaining capacity is not automatically saleable: peaks, booking gaps, fitting, briefing and reset still matter.
Pay the staff, the landlord and the operating bills
The example includes 350 monthly staff hours at an assumed fully loaded cost of $20 per hour, plus a $4,500 management replacement-cost allowance. Fully loaded means the employer’s total cost, rather than the employee’s wage alone. Keep a management allowance when the owner works in the business: otherwise the apparent profit partly comes from unpaid owner labor.
These are planning inputs. They are not a claim about the average U.S. rent, wage or insurance premium. Price the actual city, property, opening schedule, employment costs and required staffing. The SBA business-planning guide explains why startup, fixed and variable costs should be identified separately.
| Cost | Assumption | Monthly USD |
|---|---|---|
| Staff | 350 hours × $20 fully loaded | $7,000 |
| Management | Replacement-cost allowance, including when the owner manages | $4,500 |
| Rent and common-area charges | Illustrative local lease cost | $6,500 |
| Utilities / insurance / marketing | $1,000 + $500 + $1,800 | $3,300 |
| Administration / equipment parts / cleaning | $750 + $300 + $400 | $1,450 |
| Fixed and scheduled cash costs | Before sales-dependent costs | $22,750 |
| Per-game direct cost | 3,984 total player-games × $1 | $3,984 |
| Extra party supplies | 16 packages × $60, excluding costs counted elsewhere | $960 |
| Payment fees | 2.8% of $37,984 | $1,063.55 |
The model’s $300 equipment-parts allowance excludes care labor and electricity because labor and power are already elsewhere in the budget. When using the five-year equipment ownership worksheet, reconcile each line with the operating budget. Do not subtract the full five-year equipment total from every year’s profit or add its bundled annual care allowance on top of costs already included here.
Follow the money from revenue to profit
Subtract the fixed and sales-dependent cash operating costs from revenue. The working example leaves $9,226.45 before depreciation, interest and tax. Next subtract the assumed monthly book depreciation of $1,500 and loan interest of $500: pre-tax profit becomes $7,226.45.
An editable 25% planning tax allowance on positive pre-tax profit leaves $5,419.84 per month in this example. The rate is a modeling assumption, not a statement of U.S. tax law. Actual tax treatment depends on the business structure and circumstances; the IRS identifies several different business structures and related tax requirements. IRS business-structure overview.
Cash flow is a separate check. Loan principal reduces cash but is not an expense in this profit calculation; depreciation reduces book profit but is not a current cash payment. With $1,000 monthly principal repayment, cash after the example’s interest, principal and planning tax is $5,919.84. That subtotal excludes new capital purchases, working-capital changes and owner distributions.
The owner’s personal take-home pay cannot be read directly from any one of these outputs. The management allowance already charges the business for management work; personal pay, employer costs, taxes, ownership share and distribution decisions still need to be separated.
Change the inputs to match your planned club
Use the presets to explore a slow month, the working example and a busy month. Each is an illustrative scenario. Staffing changes with the preset; every other input is visible and editable. The calculator reserves complete rounds for private parties and rejects demand that exceeds the scheduled capacity.
See the profit after the costs
Working example. These are editable assumptions, not a national average or a venue forecast.
Pre-tax break-even:2,668 walk-in player-games plus 16 parties at the current assumptions.
Management replacement cost is included. Planning tax is an editable allowance, not a U.S. statutory tax rate. Cash output excludes new capital purchases, working-capital changes and owner distributions. All amounts are monthly; 48 operating weeks are spread across 12 calendar months.
| Line | USD / quantity |
|---|
The charts and scenario comparison below show the original presets. They do not change with these inputs. The calculator submits no data.
What changes between a slow month and a busy one?
Fixed costs make utilization important. A quieter month does not make rent disappear. A busier month needs enough staff to deliver the sessions. The three cases below keep the same arena capacity and selling assumptions, while changing game sales, party bookings and scheduled staff hours.
| Measure | Slow month | Working example | Busy month |
|---|---|---|---|
| Walk-in player-games | 2,000 | 3,600 | 5,000 |
| Private parties | 8 | 16 | 24 |
| Staff hours, excluding management allowance | 300 | 350 | 450 |
| Committed scheduled positions | 29% | 53% | 74.5% |
| Revenue | $20,792 | $37,984 | $53,376 |
| Operating subtotal before depreciation, interest, tax | −$4,212 | $9,226 | $20,115 |
| Profit / loss after model deductions | −$6,212 | $5,420 | $13,587 |
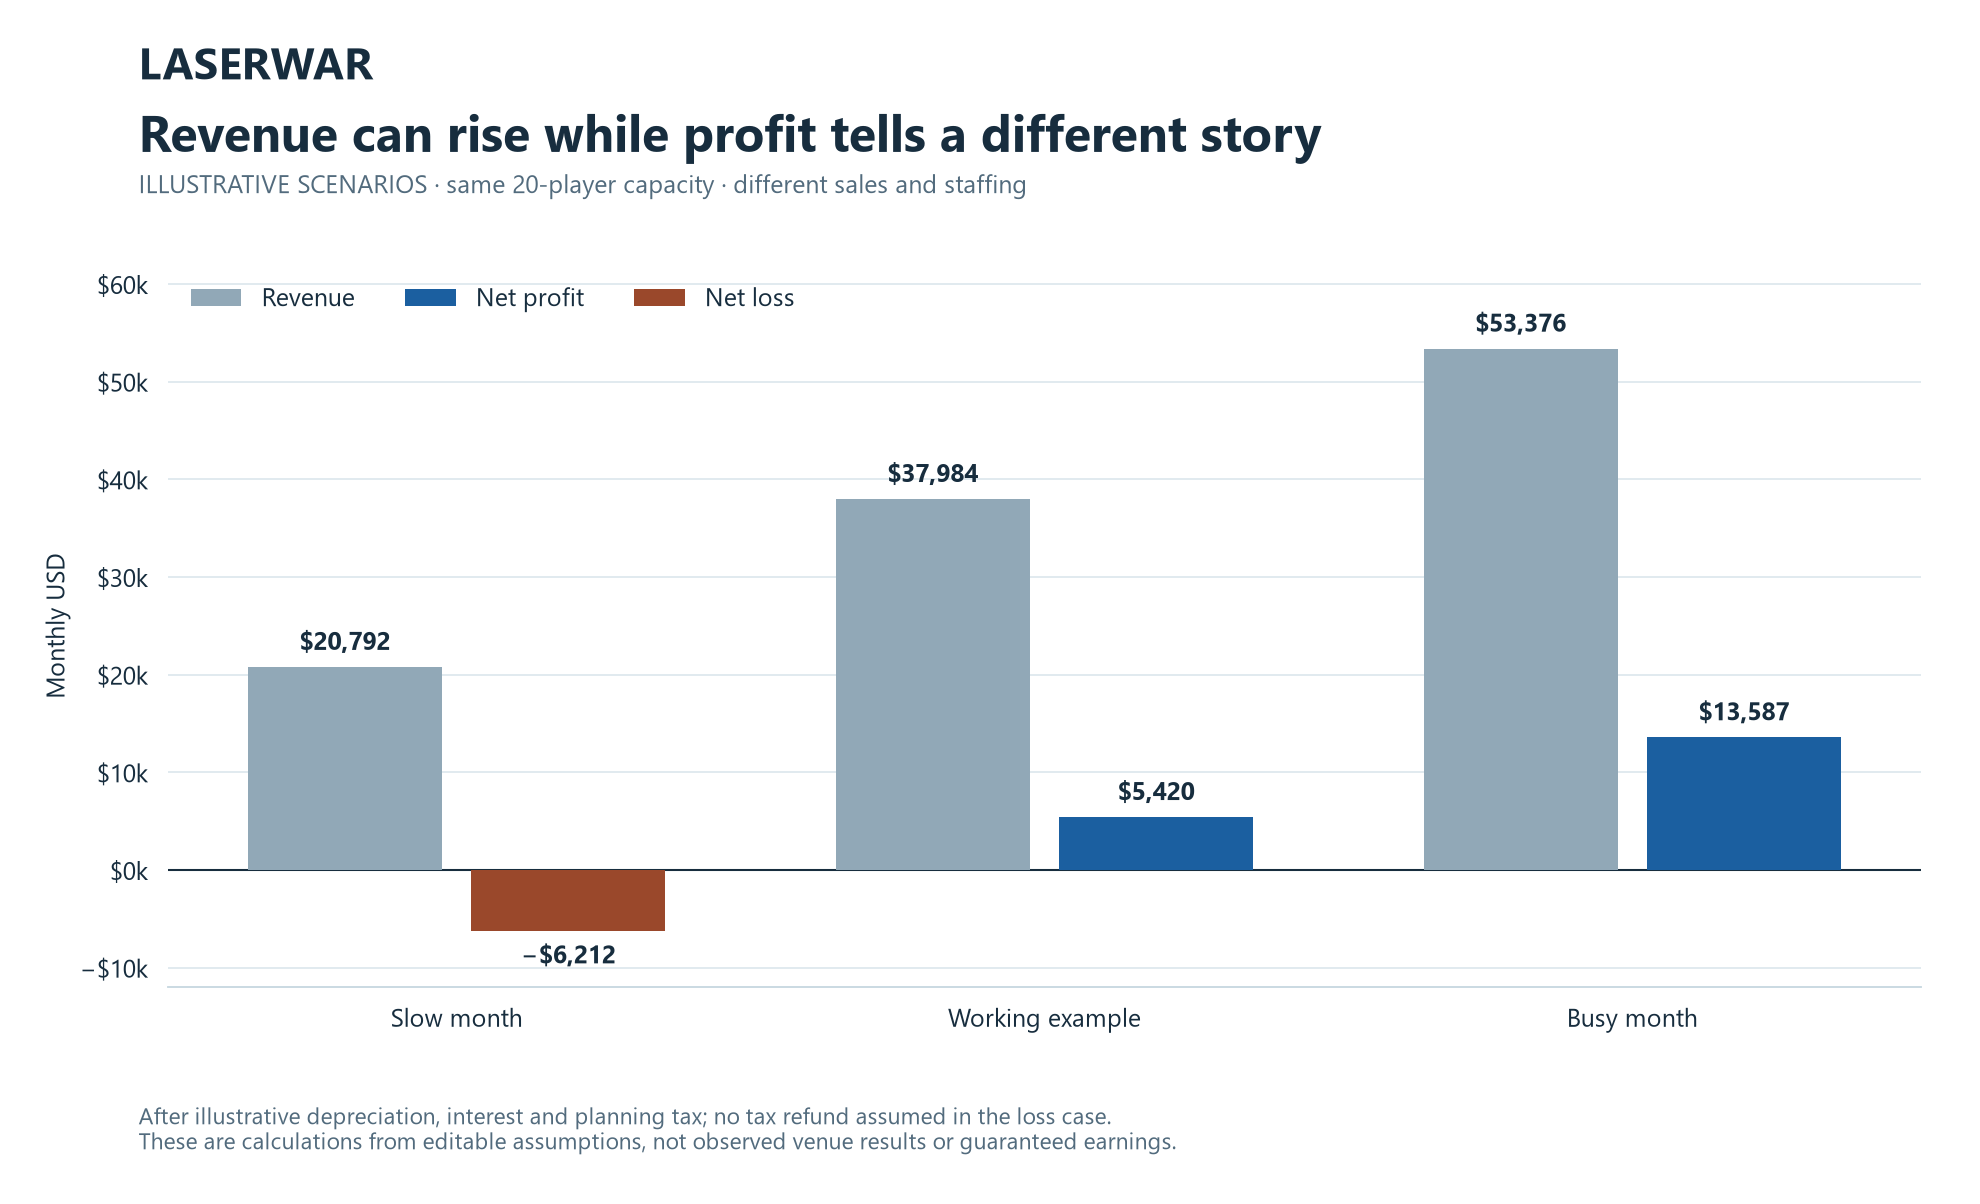
Twelve identical working-example months would produce about $65,038 of modeled annual profit. That multiplication is an annual run-rate illustration, not an annual forecast. Build a real forecast month by month, with the local school calendar, holiday trading, seasonality, closures and launch ramp-up. Do not multiply your strongest month by twelve.
How many games must the club sell to break even?
At the working-example prices and costs, each extra walk-in player-game contributes $7.748 after its $1 direct cost and 2.8% payment fee. Each party contributes $255.228 after payment fees, its 24 player-games and $60 extra supplies. These contributions pay the fixed bills before creating profit.
With 16 parties and the same staffing, rent and other fixed costs, about 2,410 walk-in player-games cover cash operating costs. Including the assumed depreciation and interest raises the zero-profit threshold to 2,668 walk-in player-games, alongside those 16 parties. This threshold remains within the planned schedule, but the model does not establish whether your local market will supply that demand.
The general method is fixed costs divided by contribution per sale. For this two-stream example, party contribution first offsets part of the fixed requirement; walk-in contribution covers the rest. The SBA break-even explanation describes the underlying contribution approach. When the business adds attractions or packages, give each its own revenue and incremental cost rather than treating all sales as equally profitable.
Choose equipment around the sales plan
A 20-player operating model needs a quotation for 20 active places plus the reserve you intend to hold. The ten-active-player catalogue examples in the ownership-cost guide cannot be reused unchanged to price this fleet. Confirm the full sensor, charging, control and reserve configuration with the supplier.
Ask the supplier to rehearse a full session, a reserve swap and the results handover. Record the time the staff need for briefing, fitting, inspection and reset. Those tasks help determine whether your proposed schedule is workable. Use the FEC selection guide, acceptance-test method and support plan to turn the purchase into an operating specification.
Reliable equipment, clear statistics and an organized support route can support the experience you sell. A percentage profit uplift requires evidence from the operation itself. Keep the claims tied to what can be demonstrated, then track bookings, realized price, refunds, staff time, unavailable sets and repeat visits after opening.
Turn the example into your local profit plan
Collect a proposed lease, staffing schedule, insurance quote and destination-specific equipment offer. Build a local competitor price table with comparable game lengths and party inclusions. Put each assumption beside its source, date and responsible person, then replace it when you obtain better evidence.
For an existing venue, use its booking and accounting exports to separate laser tag, food, arcade and other sales. Allocate shared costs consistently and record owner labor. For a new operation, model the first months of ramp-up and fund the cash shortfall as part of opening capital. Monthly operating profit does not repay the whole startup investment immediately.
Ask for a fleet that fits your capacity and budget
Send LASERWAR your location, venue format, guest age range, active-player target, reserve policy and proposed schedule. Request an itemized equipment, charging and control quotation, then insert it into your complete startup and monthly operating plan.
Discuss your U.S. laser tag project

